Note market data
Homes with a mortgage by state
Source: U.S. Census Bureau, ACS 1-year 2024.
Hold a note? Ask for a no-obligation note review. If it fits, we'll introduce you to note buyers who may make an offer.
Why homes owned outright matter for notes
Owners with no mortgage can offer owner financing more easily, because no lender's loan has to be paid off at closing. The seller can let the buyer pay over time. The buyer signs a promissory note, usually backed by a mortgage, deed of trust or land contract. The seller now holds a note.
So places with many homes owned outright have many owners who could carry financing when they sell. This data doesn't count seller-financed sales. It shows how many owners have no mortgage, which is the starting point. For more on how these notes work, see selling an owner-financed note and selling a land contract.
Highest and lowest shares of homes owned outright
Download: SVGPNGState data (CSV)
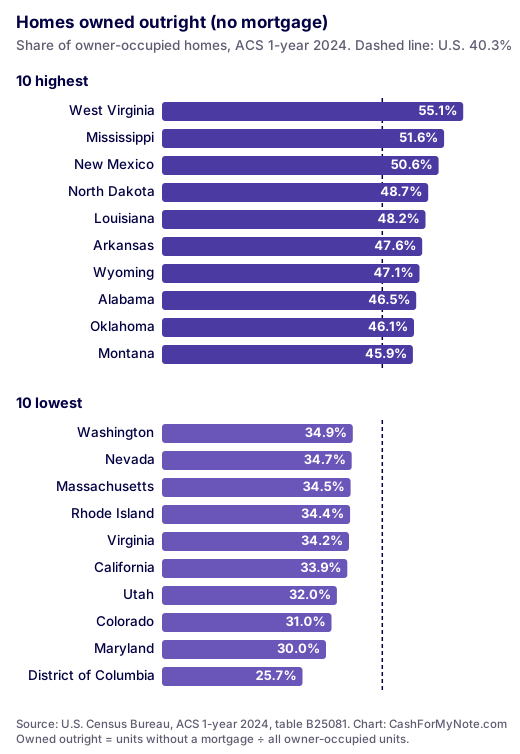
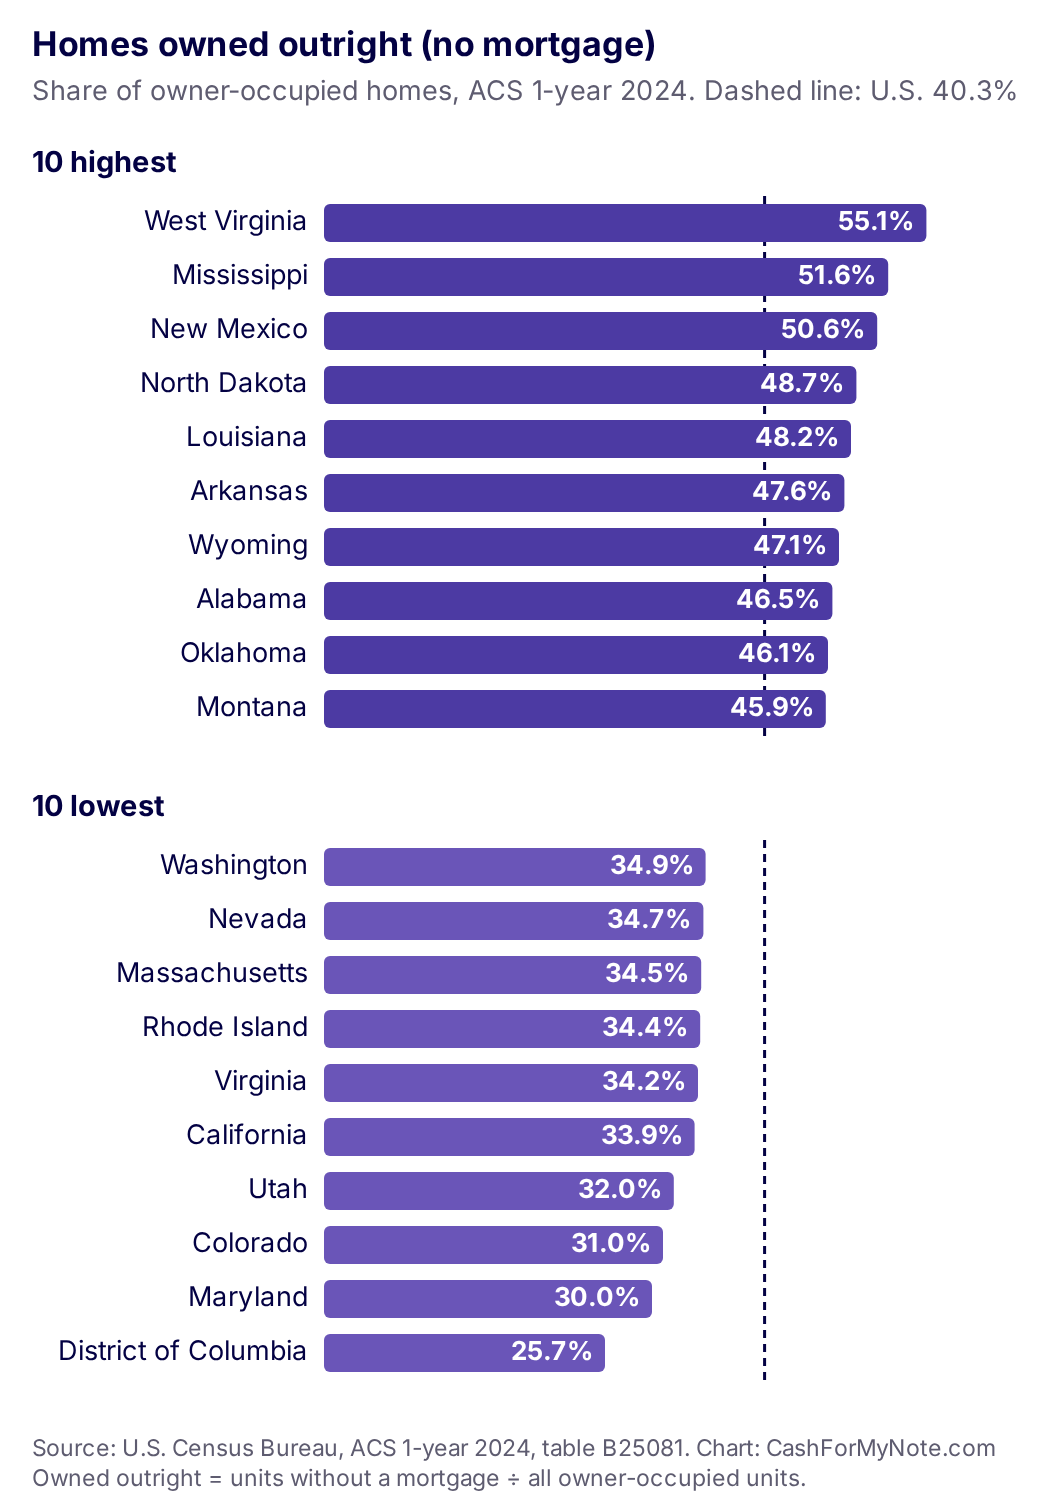
Related data: how mortgage rates affect what your note is worth, with a 10-year rate chart.
All 50 states and DC
Tap a column heading to sort. Percentages are shares of owner-occupied homes.
| Alabama | 1,461,271 | 53.5% | 46.5% | $233,300 |
|---|---|---|---|---|
| Alaska | 182,292 | 60.4% | 39.6% | $376,500 |
| Arizona | 2,020,822 | 60.6% | 39.4% | $426,000 |
| Arkansas | 836,697 | 52.4% | 47.6% | $215,600 |
| California | 7,701,876 | 66.1% | 33.9% | $759,500 |
| Colorado | 1,635,345 | 69.0% | 31.0% | $574,600 |
| Connecticut | 970,236 | 62.9% | 37.1% | $396,900 |
| Delaware | 304,189 | 62.8% | 37.2% | $371,600 |
| District of Columbia | 134,836 | 74.3% | 25.7% | $733,400 |
| Florida | 6,220,116 | 55.8% | 44.2% | $396,900 |
| Georgia | 2,798,409 | 62.7% | 37.3% | $343,300 |
| Hawaii | 304,026 | 60.7% | 39.3% | $875,900 |
| Idaho | 538,468 | 60.4% | 39.6% | $446,400 |
| Illinois | 3,449,961 | 59.7% | 40.3% | $280,700 |
| Indiana | 1,962,896 | 62.5% | 37.5% | $243,500 |
| Iowa | 958,213 | 58.1% | 41.9% | $227,300 |
| Kansas | 820,255 | 57.0% | 43.0% | $238,700 |
| Kentucky | 1,270,744 | 54.7% | 45.3% | $226,000 |
| Louisiana | 1,258,598 | 51.8% | 48.2% | $223,200 |
| Maine | 451,090 | 55.5% | 44.5% | $341,900 |
| Maryland | 1,628,167 | 70.0% | 30.0% | $436,300 |
| Massachusetts | 1,765,324 | 65.5% | 34.5% | $607,400 |
| Michigan | 3,034,798 | 56.5% | 43.5% | $254,200 |
| Minnesota | 1,692,435 | 62.6% | 37.4% | $344,600 |
| Mississippi | 829,682 | 48.4% | 51.6% | $186,500 |
| Missouri | 1,757,433 | 58.8% | 41.2% | $254,400 |
| Montana | 321,733 | 54.1% | 45.9% | $425,400 |
| Nebraska | 549,417 | 57.8% | 42.2% | $263,100 |
| Nevada | 744,844 | 65.3% | 34.7% | $455,500 |
| New Hampshire | 414,145 | 60.6% | 39.4% | $458,800 |
| New Jersey | 2,264,820 | 62.9% | 37.1% | $496,000 |
| New Mexico | 608,986 | 49.4% | 50.6% | $279,900 |
| New York | 4,252,571 | 56.8% | 43.2% | $449,800 |
| North Carolina | 3,004,713 | 60.5% | 39.5% | $333,000 |
| North Dakota | 213,886 | 51.3% | 48.7% | $266,100 |
| Ohio | 3,351,814 | 59.7% | 40.3% | $239,800 |
| Oklahoma | 1,053,182 | 53.9% | 46.1% | $222,100 |
| Oregon | 1,100,905 | 63.4% | 36.6% | $497,500 |
| Pennsylvania | 3,713,956 | 56.7% | 43.3% | $277,600 |
| Rhode Island | 284,679 | 65.6% | 34.4% | $455,700 |
| South Carolina | 1,607,358 | 57.0% | 43.0% | $299,500 |
| South Dakota | 261,078 | 54.6% | 45.4% | $289,600 |
| Tennessee | 1,957,004 | 56.5% | 43.5% | $332,600 |
| Texas | 7,134,877 | 55.5% | 44.5% | $313,200 |
| Utah | 824,019 | 68.0% | 32.0% | $545,200 |
| Vermont | 209,117 | 57.8% | 42.2% | $352,800 |
| Virginia | 2,315,258 | 65.8% | 34.2% | $403,500 |
| Washington | 1,992,341 | 65.1% | 34.9% | $602,200 |
| West Virginia | 559,415 | 44.9% | 55.1% | $170,800 |
| Wisconsin | 1,723,526 | 60.0% | 40.0% | $294,700 |
| Wyoming | 183,683 | 52.9% | 47.1% | $339,500 |
| United States | 86,635,506 | 59.7% | 40.3% | $360,600 |
Source: U.S. Census Bureau, ACS 1-year 2024, tables B25003, B25081 and B25077. Survey estimates; see the notes below.
Sold a property in one of these states and carrying the loan? Ask for a no-obligation note review. If it fits, we'll introduce you to note buyers who may make an offer.
How to read this table
- Owner-occupied homes are homes lived in by their owner (table B25003). Rentals, vacant homes and second homes aren't counted.
- With a mortgage includes a mortgage, deed of trust, contract to purchase (such as a land contract), home equity loan or similar debt.
- Owned outright means none of those. The Census Bureau's label is "without a mortgage."
- Median home value is the middle of what owners say their home would sell for (table B25077). It isn't a sale price or an appraisal.
- The figures come from a survey, so each one has a margin of error. Small gaps between states may not be meaningful. The Census Bureau publishes the margins with each table.
If you hold a note
Whatever state the property is in, note buyers look at the same basics: payment history, equity, the rate and time left, and the paperwork. Ask for a no-obligation note review. If it fits, we'll introduce you to note buyers who may make an offer. Or see how mortgage rates affect what your note is worth.
Questions
What does owned outright mean here?
The Census Bureau counts an owner-occupied home as without a mortgage when there is no mortgage, deed of trust, contract to purchase, home equity loan or similar debt on it. This page calls those homes owned outright.
Does a land contract count as a mortgage in this data?
Yes. The Census table counts homes with a mortgage, contract to purchase or similar debt together. A home being bought on a land contract or contract for deed falls in the with-a-mortgage group.
Why do owners with no mortgage matter for notes?
Owners with no mortgage can offer owner financing more easily, because no lender's loan has to be paid off at closing. When they carry the financing, the buyer signs a note, and the seller becomes a note holder.
Is the median home value a sale price?
No. It is the middle of what owners told the Census Bureau their homes would sell for. It is a survey estimate, not an appraisal or a sales record.
How current is this data?
It is the ACS 1-year 2024 release, the newest one-year release available from the Census API when this page was refreshed on Oct 24, 2026.
Embed this chart
Sources and notes
- U.S. Census Bureau, American Community Survey, ACS 1-year 2024 estimates, retrieved from the Census Data API (api.census.gov) on Oct 24, 2026. Tables: B25003 Tenure (owner-occupied units, B25003_002E), B25081 Mortgage Status (view table), and B25077 Median Value (B25077_001E).
- Formula: % with a mortgage = B25081_002E ÷ B25081_001E × 100. % owned outright = B25081_009E ÷ B25081_001E × 100. B25081_001E is the count of owner-occupied units, the same universe as B25003_002E (they match for every state in this release). Rounded to one decimal.
- One-year ACS estimates cover areas with 65,000 people or more, so every state and DC is included. Puerto Rico is published separately and isn't shown.
- This page refreshes when the Census Bureau publishes a new one-year release.
Hold a note on a home you sold?
Answer a few quick questions for a no-obligation review. If it fits, we'll introduce you to note buyers who may make an offer.
Ask for a no-obligation note reviewRelated
- Sell an owner-financed note
- Sell a land contract
- Mortgage rates and note values
- How to sell a mortgage note
Educational information only, not legal, tax or investment advice. The data describes the past. It is not a forecast, and it is not a price or offer for any note. CashForMyNote.com does not buy notes. Affiliate disclosure.